The title bar of a Display contains an icon representing the reproduction mode of that Display, which is playing ![]() or paused
or paused ![]() .
.
When in play mode, the Time Scale moves toward the future, allowing users to follows real-time values. Moving the Time Scale to the past or applying a zoom does not change the Scale's movement direction.
When Displays are grouped, only one of the Displays is in play mode and the other Displays on the group copy that movement. When removing a paused Display from a group, that Display stops its movement. If a Display is added to a moving group, this Display also starts to move.
Grouping Displays is used to link Time Scales among Displays. All Time Scales of a group contain the same zoom factor, but with different periods. This allows comparing different periods through a search, such as comparing a certain month to the previous month.
To create a group of Displays, click the ![]() icon on the title bar of the Displays. To remove a Display from a group, click the
icon on the title bar of the Displays. To remove a Display from a group, click the ![]() icon on the title bar of the Display.
icon on the title bar of the Display.
When grouped, all Displays share the same reproduction mode. Click the ![]() icon to play and the
icon to play and the ![]() icon to pause reproduction. The Search, Zoom, and Select modes are executed in all Displays of a group, according to the relation among periods.
icon to pause reproduction. The Search, Zoom, and Select modes are executed in all Displays of a group, according to the relation among periods.
When right-clicking the area of a Display, the contextual menu of the next figure is displayed, in which users can select the options described on the next table.
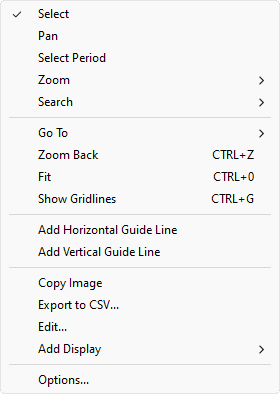
Contextual menu of a Display area
Available options on the contextual menu of a Display area
Option |
Description |
|---|---|
Select |
Allows selecting a specific Pen from a Display |
Pan |
Allows dragging the Time and Numeric Scales without changing the zoom factor |
Select Period |
Allows selecting a specific period of time. When selecting this option, the mouse cursor changes to |
Zoom |
Allows plotting a specific area of a Display. Possible values in this option are Zoom XY: Plots a region both on vertical and horizontal axes, Zoom X: Plots a region only on the horizontal axis, or Zoom Y: Plots a region only on the vertical axis |
Search |
Allows viewing values from Pen points or executing an interpolation. Possible values in this option are described on table Available options on the Search mode |
Go To |
Allows adjusting the Time Scale to pre-determined periods. Possible values for this option are Last Day, Last Hour, Last Half Hour, Last 10 Minutes, or Now |
Zoom Back |
Moves back to the previously selected zoom level, if available |
Fit |
Fits the Pens from the selected Display inside the selected period of time |
Show Gridlines |
Enables viewing grid lines on the plot area of a Display |
Add Horizontal Guide Line |
Adds a horizontal guide line on the Display. For more information about this option, please check the text later |
Add Vertical Guide Line |
Adds a vertical guide line on the Display. For more information about this option, please check the text later |
Copy Image |
Copies the current Display area to Windows Clipboard as an image in PNG format |
Export to CSV |
Exports the content of a Display to a file in CSV (Comma-Separated Values) format. Clicking this option opens the Export window, described later |
Edit |
Allows editing a Display. Clicking this option opens the edition window, described later |
Add Display |
Allows adding a new Display. Possible values for this option are At the Top, On the Right, On the Left, or At the Bottom |
Options |
Allows configuring several options of a Display. Clicking this option opens the Options window, described later |
When selecting the Search option, the contextual menu on the next figure is displayed, and the available options are described on the next table.
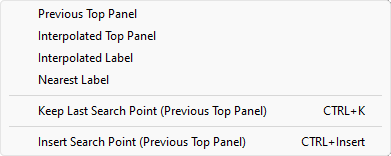
Search options
Available options on the Search mode
Option |
Description |
|---|---|
Previous Top Panel |
Allows viewing the timestamp, the value, and the name of a point before the mouse pointer |
Interpolated Top Panel |
Allows viewing the timestamp, the value, and the name of an interpolated point relative to the point before and after the mouse pointer |
Interpolated Label |
Allows viewing the value of an interpolated point relative to the point before and after the mouse pointer |
Nearest Label |
Allows viewing the value of the point nearest to the mouse pointer |
Keep Last Search Point |
Allows the mouse pointer to remain fixed on the screen during a search |
Inserts a search point on the screen center, using the last search configuration from the current session or using the Nearest Label mode if no search was performed |
When clicking Export to CSV, the window on the next figure is displayed.
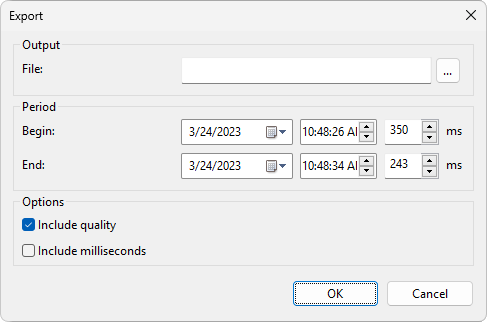
Export window
The available options on this window are described on the next table.
Available options on the Export window
Option |
Description |
|---|---|
File |
Allows indicating an output file for exporting. Click |
Begin |
Allows selecting a date and time to start exporting |
End |
Allows selecting a date and time to finish exporting |
Include quality |
Allows including a Pen's quality on export |
Include milliseconds |
Allows including milliseconds in the indicated periods |
When clicking Edit, the window on the next figure is displayed.
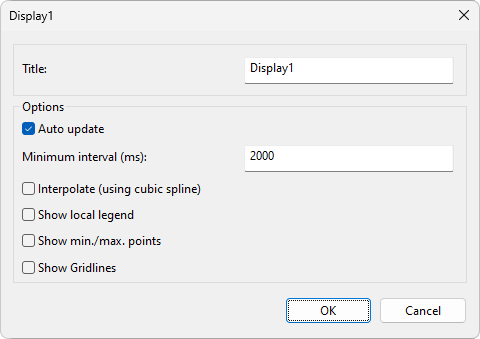
Edit window of a Display
The available options on this window are described on the next table.
Available options on the edition window of a Display
Option |
Description |
|---|---|
Title |
Title of a Display |
Auto update |
Enables or disables the auto update mode |
Minimum interval (ms) |
Minimum updated interval, in milliseconds. The minimum accepted value in this options is two seconds, or 2000 ms |
Interpolate (using cubic spline) |
Uses a cubic spline interpolation to draw a Display |
Show local legend |
Shows or hides a legend with the Pen's name and its respective color |
Show min./max. points |
Shows or hides the maximum and minimum points on a Display |
Show Gridlines |
Shows or hides the grid lines on a Display |
When clicking Options, the window on the next figure is displayed.
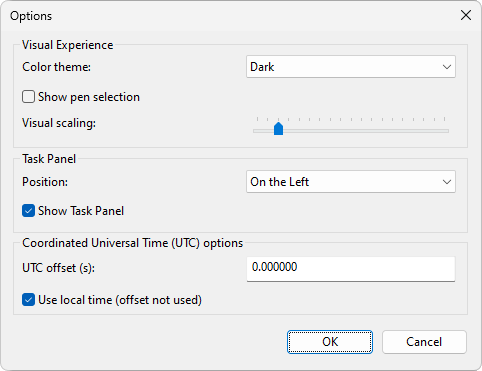
Options window
The available options on this window are described on the next table.
Available options on the Options window
Option |
Description |
|---|---|
Color theme |
Allows selecting a color theme for a Display. Possible values are Light or Dark |
Show pen selection |
Shows the highlighted Pen on a Display |
Visual scaling |
Allows configuring the scale of visual elements on TrendAnalysis. Possible values for this option range from 50% to 500% and the default value is 100% |
Position |
Allows selecting the position to show the task panel with the Displays, Bookmarks, and Connections tabs. Possible values are At the Top, At the Bottom, On the Left, or On the Right |
Show Task Panel |
Shows or hides the task panel |
UTC offset (s) |
Allows indicating a time offset, in seconds, to the time of Pens on a Display |
Use local time (offset not used) |
Uses the local time, ignoring the UTC offset (s) option |
Horizontal and Vertical Guide Lines are part of a set of functionality that helps an analyst in the process of visually analyzing data. The main function of Guide Lines is to help the visual identification of periods in which data exceeds the limits defined by the Lines.
To add a Horizontal Guide Line, right-click the area of a Display and select the Add Horizontal Guide Line option. To move a Horizontal Guide Line, click and drag it to the desired position. To edit it, right-click the Guide Line and select the Edit option to show the window on the next figure.
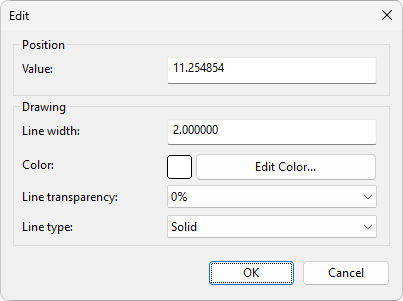
Window to edit a Horizontal Guide Line
The available options on this window are described on the next table.
Available options on the Edit window of a Horizontal Guide Line
Option |
Description |
|---|---|
Value |
Value of the Guide Line's position relative to the Vertical Scale |
Line width |
Line's width, in pixels |
Color |
Color of a Guide Line. Click Edit Color to select a color on the Windows default color selection window |
Line transparency |
Level of transparency of a Guide Line, as a percentage. Possible values range from 10% to 100% |
Line type |
Type of line. Possible values are Solid: Solid line, Dash: Dashed line, Dash Dot: Line with dashes and dots, Dash Dot Dot: Line with dashes, dots and dots, and Dot Dot Dot: Dotted line |
To add a Vertical Guide Line, right-click the area of a Display and select the Add Vertical Guide Line option. To move a Vertical Guide Line, click and drag it to the desired position. To edit it, right-click the Guide Line and select the Edit option to show the window on the next figure.
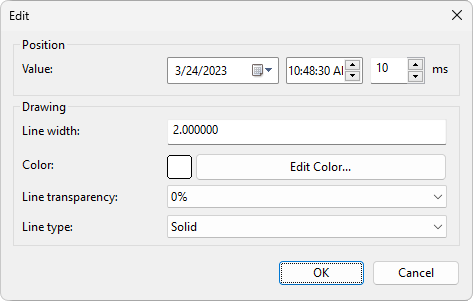
Window to edit a Vertical Guide Line
The available options on this window are described on the next table.
Available options on the Edit window of a Vertical Guide Line
Option |
Description |
|---|---|
Value |
Value of the Guide Line's position relative to the Horizontal or Time Scale |
Line width |
Line's width, in pixels |
Color |
Color of a Guide Line. Click Edit Color to select a color on the Windows default color selection window |
Line transparency |
Level of transparency of a Guide Line, as a percentage. Possible values range from 10% to 100% |
Line type |
Type of line. Possible values are Solid: Solid line, Dash: Dashed line, Dash Dot: Line with dashes and dots, Dash Dot Dot: Line with dashes, dots and dots, and Dot Dot Dot: Dotted line |
Both Horizontal and Vertical Guide Lines can be copied and pasted on other Displays. To do so, right-click a Guide Line and select the Copy Guide Line option. Then, right-click the desired Display and select either the Paste Horizontal Guide Line option or the Paste Vertical Guide Line option. To remove a Guide Line, right-click it and select the Remove Guide Line option. To lock a Horizontal or Vertical Guide Line in a certain position, right-click it and select the Lock Guide Line Position option.
Users can also add a Horizontal Guide Line linked to a Pen. To do so, right-click a Pen and select the Add Associated Horizontal Guide Line option. In this case, the Guide Line moves automatically to the average, minimum, or maximum value of the linked Pen. The window to edit this type of Guide Line, available in the contextual menu's Edit option, contains an extra Type option, shown on the next figure.
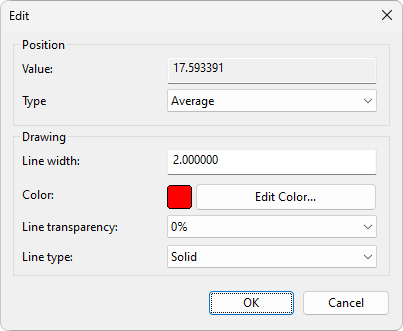
Window to edit a Horizontal Guide Line linked to a Pen
The available options for the Horizontal Guide Line linked to a Pen are Minimum: The Guide Line moves automatically with the minimum value, Average: The Guide Line moves automatically with the average value, or Maximum: The Guide Line moves automatically with the maximum value.
NOTES |
•The drawing width of Horizontal and Vertical Guide Lines is independent from the screen resolution of the current device. •The value of the Average option corresponds to the average of values effectively shown on a Display, which may be different from the average of values requested for the Tags. |
Each Display can contain one or more Plot Areas. A Plot Area groups Pens and Vertical Scales in the same Display. All Plot Areas use the same Time Axis, which is unique for a Display.
When the mouse pointer is over a Display's area, the ![]() and
and ![]() options are shown below the legend and allow, respectively, adding or removing a Plot Area. The add option stacks a new Plot Area on the Display and the remove option deletes the top Plot Area of a Display. Pens and Axes linked to a Plot Area are also removed.
options are shown below the legend and allow, respectively, adding or removing a Plot Area. The add option stacks a new Plot Area on the Display and the remove option deletes the top Plot Area of a Display. Pens and Axes linked to a Plot Area are also removed.
NOTES |
•If users want to keep the Pens used on a Plot Area, drag them to another Plot Area or to another Display before removing them. •Plot Areas, by default, are removed in reverse order of insertion when using the |