This tab displays Pens corresponding to data available on the Connections tab. When right-clicking a Display, the contextual menu of the next figure is displayed, and the available options are described on the next table.
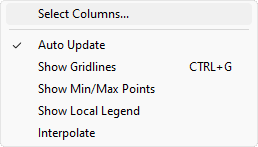
Contextual menu of a Display
Available options on the contextual menu of a Display
Option |
Description |
|---|---|
Select Columns |
Allows selecting which columns are displayed for Pens |
Auto Update |
Enables or disables the auto-update mode |
Show Gridlines |
Shows or hides grid lines on Pens area |
Show Min/Max Points |
Shows or hides minimum and maximum points of Pens |
Show Local Legend |
Shows a legend with the name of the Pen and its respective color |
Interpolate |
Uses interpolation to draw a Display |
When selecting the Select Columns option, the window on the next figure is displayed.
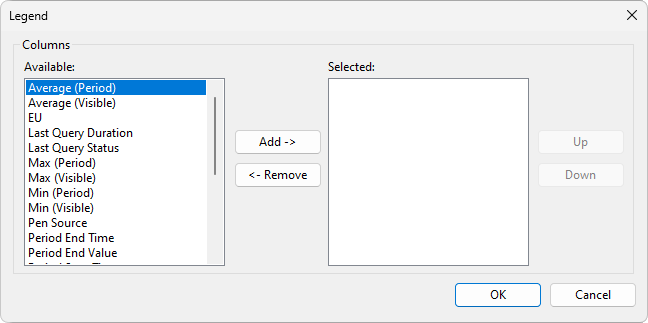
Legend window
The available options on this window are described on the next table.
Available options on the Legend window
Option |
Description |
|---|---|
Available |
Available columns for viewing. Please check the next table for more information about these columns |
Add |
Moves the selected column to the Selected list |
Remove |
Removes the selected column from the Selected list |
Up |
Moves the selected column one position up on the Selected list |
Down |
Moves the selected column one position down on the Selected list |
Selected |
Columns selected for viewing |
The available columns for viewing are described on the next table.
Columns available for viewing
Column |
Description |
|---|---|
Average (Period) |
Average of the period queried |
Average (Visible) |
Average of the visible period on a Display |
EU |
Engineering unit of a Pen's value |
Last Query Duration |
Elapsed time of the last query, in milliseconds |
Last Query Status |
Status of the last query |
Max (Period) |
Maximum value of a Pen in the period queried |
Max (Visible) |
Maximum value of a Pen in the visible period of the Display |
Min (Period) |
Minimum value of a Pen in the period queried |
Min (Visible) |
Minimum value of a Pen in the visible period of the Display |
Pen Source |
Source Tag of a Pen's data |
Period End Time |
Final date and time of the period queried |
Period End Value |
Final interpolated value of the period queried |
Period Start Time |
Initial date and time of the period queried |
Period Start Value |
Initial interpolated value of the period queried |
Period Time Span |
Time interval of the period queried |
Period Value Span |
Value interval of the period queried |
Points Received |
Total number of points received from the Pen |
Quality |
Quality of a Pen's value in the search point |
Timestamp |
Timestamp of a Pen's value in the search point |
Value |
Pen's value in the search point |
Vertical Scale Max |
Maximum value of the Vertical Scale |
Vertical Scale Min |
Minimum value of the Vertical Scale |
Vertical Scale Title |
Title of the Vertical Scale |
The columns EU, Quality, Timestamp, and Value correspond, respectively, to the properties EU, Quality, TimeStamp, and Value of search points in Pens. If there are no search points defined, these columns display an indication of "No Search Point". On the other hand, the columns Average, Max, and Min correspond, respectively, to the average, maximum, and minimum values of the interval of values requested for the Tags.
NOTES |
•To reorder the columns of a Legend, use the Up or Down options. •The available options for columns of a Legend, including their width, only apply to the selected Display. •The value of the Average column is based on data that, in very small zoom levels, may be compressed, therefore it can change the value effectively calculated. |
Each Pen has a check box, which indicates whether they are visible on a Display, an icon with a color, and a name. When right-clicking a Pen, the contextual menu on the next figure is displayed, and the available options are described on the next table.
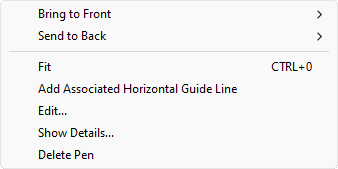
Contextual menu of a Pen
Available options on the contextual menu of a Pen
Option |
Description |
|---|---|
Bring to Front |
Moves the selected Pen one position up in the overlay order of Pens. The available options are Bring to Front: Moves the selected Pen to the first position or Bring Forward: Moves the selected Pen one position up |
Send to Back |
Moves the selected Pen one position down in the overlay order of Pens. The available options are Send to Back: Moves the selected Pen to the last position or Send Backward: Moves the selected Pen one position down |
Fit |
Fits the Pen from the selected Display on both vertical and horizontal axes |
Add Associated Horizontal Guide Line |
Adds a Horizontal Guide Line linked to this Pen automatically |
Edit |
Allows editing information about the selected Pen |
Show Details |
Shows a window with detailed information about a Pen |
Delete Pen |
Removes the selected Pen from the Display |
NOTES |
•When deselecting the check box near a Pen, that Pen stops receiving real-time data. •Clicking the color icon of a Pen opens the Windows standard dialog box for selecting colors. |
When selecting the Edit option on the contextual menu of a Pen, the window on the next figure is displayed.
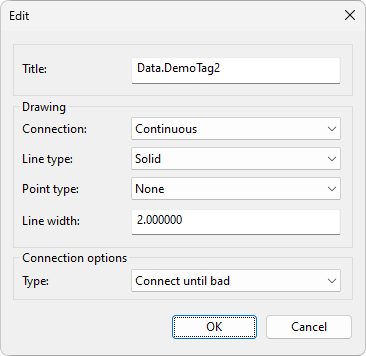
Edit window
The available options on this window are described on the next table.
Available options on the Edit window
Option |
Description |
|---|---|
Title |
Allows changing the title of a Pen |
Connection |
Allows selecting the type of connection of a Pen. Possible values are Discrete or Continuous |
Line type |
Allows selecting the type of line of a Pen. Possible values are None: No line, only dots, Solid: Solid line, Area: Draws the Pen's area, Dash: Dashed line, Dash Dot: Line with dash-dot, or Dash Dot Dot: Line with dash-dot-dot |
Point type |
Allows selecting the type of points of a Pen. Possible values are None: No indication of points, Circle, Square, Triangle, or Diamond |
Line width |
Allows configuring the width of the drawing line of a Pen |
Type |
Allows configuring the type of connection. Possible values are Don't connect bad points: Does not connect points with bad quality, Connect until bad: Connects points until quality turns bad, or Ignore bad: Ignores points with bad quality |
Scan (ms) |
Allows configuring the scan time of a Pen |
NOTE |
The Line type and Point type options cannot be configured simultaneously with the value None. |
When clicking the Show Details option on the contextual menu of a Pen, the window on the next figure is displayed.
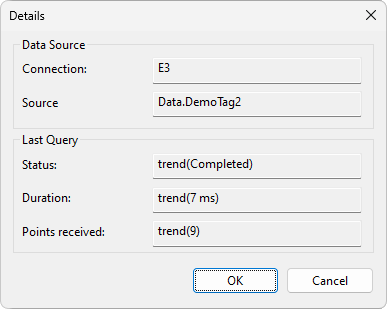
Details window
The available options on this window are described on the next table.
Available options on the Details window
Option |
Description |
|---|---|
Connection |
Shows the name of a Pen's connection |
Source |
Shows a Pen's data source. For remote Tags, the format of this option is the same as described on topic Link Syntax |
Status |
Shows the status of the last query of a Pen |
Duration |
Shows the duration time of the last query of a Pen |
Points received |
Shows the number of points received during the last query of a Pen |
Users can also edit vertical, Numeric, and horizontal, Time, Scales of a Display. The next figure shows the contextual menu with the available option for the Numeric Scale.

Options for the Numeric Scale
Select the Edit option to open the window on the next figure.
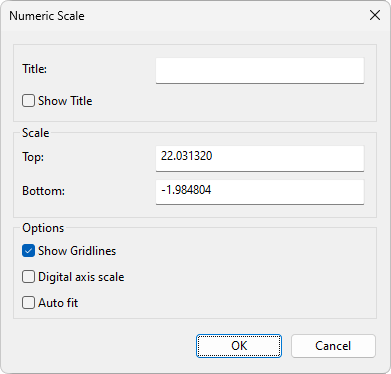
Numeric Scale window
The available options on this window are described on the next table.
Available options on the Numeric Scale window
Option |
Description |
|---|---|
Title |
Title of the Vertical Scale |
Show Title |
Enables or disables viewing the Vertical Scale |
Top |
Maximum value of the Vertical Scale |
Bottom |
Minimum value of the Vertical Scale |
Show gridlines |
Enables or disables viewing Vertical Scale grid lines relative to Time Scale |
Digital axis scale |
Adjusts the Vertical Scale for viewing digital or discrete variables |
Auto fit |
When selecting this option, Pens using this Vertical Scale are permanently adjusted to the visible period. In this mode, users cannot drag the Vertical Scale |
The next figure shows the contextual menu with the available options for the Time Scale.

Options for the Time Scale
Select the Edit option to open the window on the next figure.
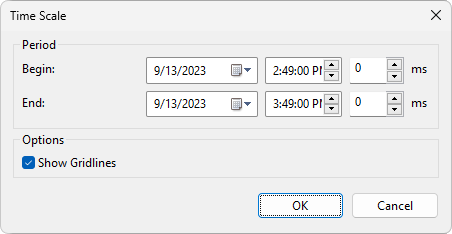
Time Scale window
The available options on this window are described on the next table.
Available options on the Time Scale window
Option |
Description |
|---|---|
Begin |
Initial date and time displayed on the Time Scale |
End |
Final date and time displayed on the Time Scale |
Show gridlines |
Shows or hides grid lines relative to the Time Scale |
NOTE |
To add or delete Numeric Scales, use the |