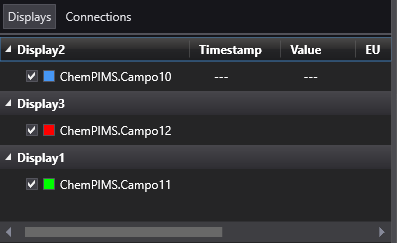
The Task Panel contains the Displays and Connections tabs. The Displays tab lists all Displays and their respective Pens, according to the next figure.

Displays tab
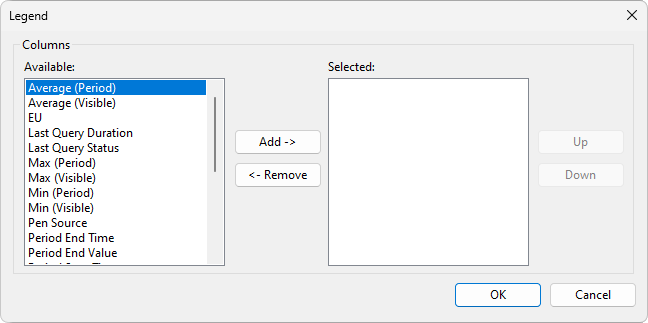
Right-click a Display's name and select the Select columns option to select the columns to show on this tab, according to the next figure.

Legend window
The available options on this window are described on the next table.
Available options on the Legend window
Option |
Description |
|---|---|
Available |
Columns available for viewing. Please check the next table for more information about these columns |
Add |
Moves the selected column to the Selected list |
Remove |
Removes the selected column from the Selected list |
Up |
Moves the selected column one position up on the Selected list |
Down |
Moves the selected column one position down on the Selected list |
Selected |
Columns selected for viewing |
NOTES |
•To reorder the columns of a Legend, use the Up ou Down options. •The available options for Legend columns, including their width, only apply to the selected Display. •The value of the Average column corresponds to the average of values effectively shown on a Display, which may be different from the average of all values. •The contextual menu of the Displays tab also contains the Auto Update, Show Grid Lines, Show Local Legend, and Interpolate options, described in details on topic Home Tab. •For more information about the configuration of Pens, please check topic Pens. |
The available columns for a Legend are described on the next table.
Available columns for a Legend
Column |
Description |
|---|---|
Average (Period) |
Average of the period queried |
Average (Visible) |
Average of the visible period on a Display |
EU |
Engineering unit of a Pen's value |
Last Query Duration |
Elapsed time of the last query, in milliseconds |
Last Query Status |
Status of the last query |
Max (Period) |
Maximum value of a Pen in the period queried |
Max (Visible) |
Maximum value of a Pen in the visible period of the Display |
Min (Period) |
Minimum value of a Pen in the period queried |
Min (Visible) |
Minimum value of a Pen in the visible period of the Display |
Pen Source |
Source Tag of a Pen's data |
Period End Time |
Final date and time of the period queried |
Period End Value |
Final interpolated value of the period queried. Please check the next note for more information about the behavior of this column |
Period Start Time |
Initial date and time of the period queried |
Period Start Value |
Initial interpolated value of the period queried. Please check the next note for more information about the behavior of this column |
Period Time Span |
Time interval of the period queried |
Period Value Span |
Value interval of the period queried |
Points Received |
Total number of points received from the Pen |
Quality |
Quality of a Pen's value in the search point |
Timestamp |
Timestamp of a Pen's value in the search point |
Value |
Pen's value in the search point |
Vertical Scale Max |
Maximum value of the Vertical Scale |
Vertical Scale Min |
Minimum value of the Vertical Scale |
Vertical Scale Title |
Title of the Vertical Scale |
The Period Start Value and Period End Value columns have the following behavior: •If the selected period does not have points with good quality, no value is displayed on these columns. •If the selected period contains points with good quality crossing the Vertical Scale only at the beginning, the Period End Value column does not display any value. •If the selected period contains points with good quality crossing the Vertical Scale only at the end, the Period Start Value does not display any value. •If the selected period contains points with bad quality before or after the beginning or the end, the Period Start Value and Period End Value columns show the value of the real point closest to the Vertical Scale that represents the respective interval. |
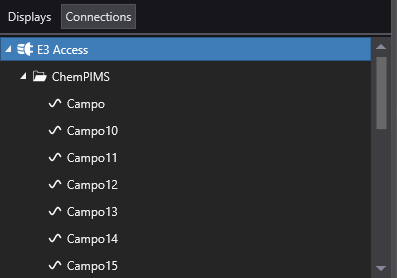
The Connections tab shows the available connections and their respective Pens, according to the next figure.

Connections tab
Right-clicking a Connection allows users to use the options described on the next table.
Available options for a Connection
Option |
Description |
|---|---|
Refresh |
Updates data for this Connection |
Edit |
Allows editing this Connection's configurations. Please check topic Connections for more information about this option |
Pen Filter |
Opens the Pen Filter window, shown on the next figure, which allows filtering Pens of a Connection by name |
Delete |
Removes the selected Connection |

Pen Filter window
Type the name of a Pen in the Filter field to start filtering by a Pen's name. For case-sensitive searches, select the Match case option. The window on the next figure shows an example of filtering.

Result of filtering Pens
Click OK to save the current filter, whose configuration is shown next to the Connection's name. To remove a filter, right-click a Connection's name and select the Delete Pen Filter option.