Elipse Event Log Viewer, from now on referred only as Log Viewer, views messages of a supervisory system stored on files in Event Trace Logfile (.etl) format. These logs store information about Elipse Software systems on user's computer.
Basically, processes store these messages on disk using pre-configured folders, which are created by the log system when it is started. A service executing on the system is responsible for managing the size of files on the log folder, as well as their lifespan. If this service is disabled or is not executing, users cannot perform a file management.
The main function of Log Viewer is to display system-generated messages to users, by using filter and search functions, making the task of searching for errors easier.
IMPORTANT |
These logs are only enabled by users belonging to Windows Administrator or Performance Log Users groups. For more information, please check topic Security Restrictions. |
Log Viewer presents the following features:
•Opens files in ETL format
•Opens more than one file at a time, merging the content of these files
•Searches for messages
•Filters messages by type and by time
•Views log sessions in use
•Exports events to files with tab-separated columns
•Configures view options
•Configures storage options of messages on disk
•Allows selecting and copying events to the Clipboard
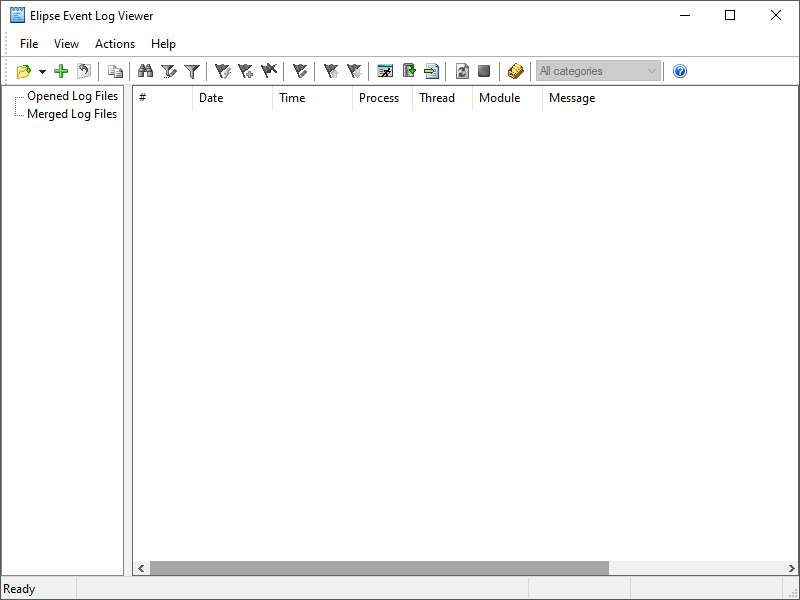
To use Log Viewer, select the Log Viewer item on Windows Start menu to open a window similar to the one on the next figure.

Elipse Event Log Viewer's main window
This program is divided into an area on the left side to view files and an area on the right side to view events. Above these areas there is a toolbar and below there is a status bar. The available options on this toolbar are described on the next table.
Available options on the toolbar
Option |
Description |
|---|---|
Open Event File (CTRL + O) |
Opens a log file |
Merge Event Files (CTRL + M) |
Opens several files and merges their events chronologically on the same view |
Close File (CTRL + F4) |
Closes the selected file |
Copy (CTRL + C) |
Copies the selected events to the Clipboard |
Find (CTRL + F) |
Opens a window to search for messages |
Filter Editor (CTRL + I) |
Shows a window to edit filters |
Toggle filter ON/OFF (F6) |
Turns on or off all filters on the events of the selected file |
Refresh View (F5) |
Refreshes the view with the last events stored on disk. If there are events in memory, they are stored on disk before refreshing |
Cancel Refresh (SHIFT + F5) |
Cancels a view refresh with the files on disk |
Edit Bookmarks (CTRL + SHIFT + E) |
Opens an edition window, which allows removing a bookmark, removing all bookmarks, or locating a bookmark |
Add Fast Bookmark (CTRL + B) |
Creates a bookmark with a default name Bookmarkn, where n is an automatically incremented number |
Add Bookmark (CTRL + A) |
Creates a bookmark, by opening a window to select its name |
Remove Bookmark (CTRL + R) |
Removes the selected bookmark |
Previous Bookmark (SHIFT + F2) |
Selects the previous bookmark |
Next Bookmark (F2) |
Selects the next bookmark |
Running Loggers (CTRL + S) |
Shows all active log sessions on the system |
Collect Files (F8) |
Opens the Elipse Event Log Collector's window |
Export Events (CTRL + E) |
Opens the Elipse Event Log Export's window |
Storage Settings (CTRL + T) |
Displays the file storage configuration window |
Post-Filtering by Category |
Allows selecting a category to sort messages. To toggle between existing categories, use the shortcut keys SHIFT + F6 to select the previous category and CTRL + F6 to select the next category |
Help (F1) |
Opens Elipse Event Log User's Manual |
The available categories for message sorting are described on the next table.
Available categories for message sorting
Number |
Category |
Color |
|---|---|---|
0 (zero) |
Log header |
Green |
10 |
Error |
Red |
11 |
Warning |
Yellow |
12 |
Information |
Blue |
14 |
Message for general usage |
-- |
15 |
Statistical and performance data |
-- |
16 |
Trace |
-- |
17 |
Additional information about a module |
Purple |
The status bar of Log Viewer's main window is divided into the areas shown on the next table.
Areas of Log Viewer's status bar
Area |
Description |
|---|---|
Number of events |
Number of events of the selected file on the viewing area. If there is no file open, it displays the text "Ready". In case there is any active filter, the displayed value refers to events visible after applying that filter. In case of loss of events, displays the total number of events lost and the percentage of loss relative to the total number of events |
Selection |
Displays information about time interval between two events. The available options are Timespan between events: a time interval between two events, with a precision of milliseconds, Interval: the number of existing events between the selected events, and Average: a time average between two selected events, with a precision of milliseconds. In case there are more than two events selected, this area only displays the Selection count option, with the number of selected events |
Processing |
Displays the percentage of successfully processed events in the selected file |
Filters |
Displays whether there is any active filter in the selected file |