The following example shows how to update an E3Chart with historical data from the last hour. For this example, users must have a Query to a previously created table on a database.
1.Create an E3Chart on a Screen.
2.Open this E3Chart's Properties Window and select the Axis tab. Click the Configure option of the Horizontal Axis and, on the Scale tab, select the Time Interval (Historic Data) option.
3.Select the Queries tab and click Add. E3 Studio opens a dialog box to indicate the name of a database server where this query's table is stored.
4.Select a database server on this dialog box and click OK. E3 Studio opens this Query's configuration window.
5.On the historical table, select the E3TimeStamp field and any other data field to display on this chart.
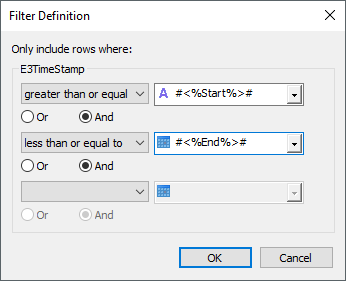
6.In the E3TimeStamp field, create a filter according to the specification on the next figure.

Filter for the E3TimeStamp field
7.After creating a filter based on the previous specification, click OK.
8.Create a new Pen. Open this Pen's Properties Window and, on the Data tab, Pen Type item, select the Historic option using the Query and indicate the configured Query field.
9.In the Vertical Axis Field item, indicate a field from the table. In the Horizontal Axis Field item, indicate the E3TimeStamp field. Click OK.
10.Create a new Command Button on this Screen and, in its Caption property, type the expression "Update Historical E3Chart".
11.Select the Scripts tab of this Command Button and, on its Click event, type the next script.
Sub CommandButton3_Click()
Set Chart = Screen.Item("E3Chart1")
Query.SetVariableValue "Start", Now – 1 / 24
Query.SetVariableValue "End", Now
Chart.HorScaleBegin = Now – 1 / 24
Chart.HorScaleEnd = Now
Chart.Queries.UpdateData()
End Sub
12.Execute this project and check its results.