•Simulate values for four levels of the equipment on failure, with values ranging between 0 (zero) and 100
1.To simulate values, create Demo-type Tags, with their maximum and minimum limits as specified.
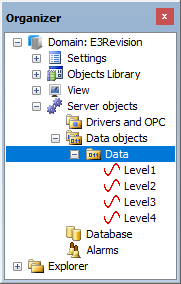
Demo Tags
•The main Screen must contain an image of the mining site
1.Insert the figure as a Resource.
2.Change the Screen's FillStyle property to 12 - bkPicture.
3.Type the name of the figure in the Screen's PictureFile property.
•Above each tank, view its respective level using a bar
1.Insert a Rectangle on the Screen above the tank.
2.Open this Rectangle's Properties Window and select the Links tab.
3.Create a Link between the VerticalPercentFill property and the corresponding Level Tag.
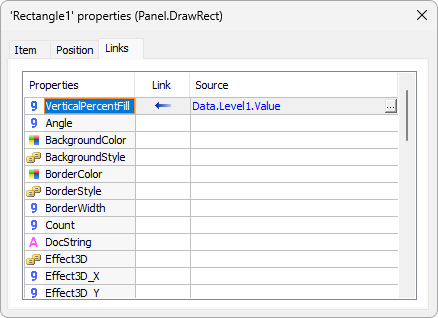
Link with the VerticalPercentFill property
•Display the level value on the Screen formatted with its engineering unit as "%", one decimal place, and obeying a color table
1.As there are several duplicated Displays, the best option is to create an XControl.
2.Create a library file and insert it in the Domain.
3.Insert an XControl and name it as "DisplayLevel".
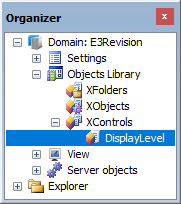
DisplayLevel object
4.Create a Double-type property named "Level".

Level property
5.Draw a Display.
6.Format the Display with the expression '0.0 "%"'.
7.Create a Simple Connection between the Level property and the Display's Value property.
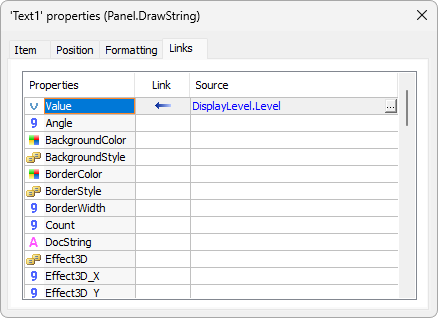
Link with the Level property
8.Create a Table Connection in the ForegroundColor property, informing limits and colors. In the Source property, select the previously created Level property.
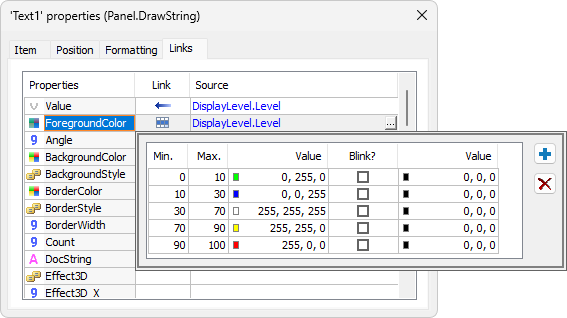
Table Connection
9.Save the library and register it.
10.Insert on the Screen a DisplayLevel-type XControl.
11.Create a Simple Connection between the Level property and the desired Tag.
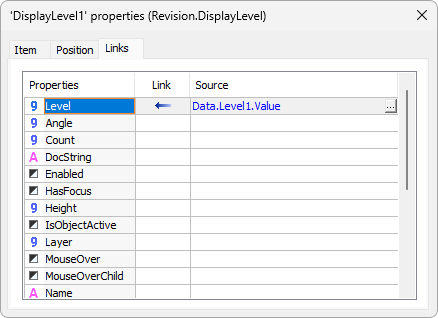
Simple Connection
•Display on screen the alarms of all levels, according to a table
1.If the Domain does not have one yet, insert an Alarm Server object in it.
2.If the Domain does not have one yet, insert an Alarm Configuration in it.
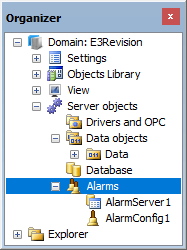
Alarm Server and Configuration
3.In the Alarm Configuration, insert an Alarm Area.
4.In the Alarm Area, insert an Analog Alarm.

Analog Alarm
5.Open the Alarm Source's Properties Window and select the Analog tab. Inform limits and alarm messages according to the table.
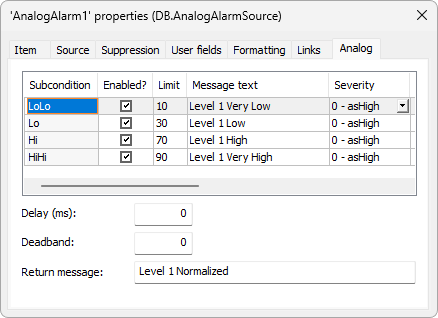
Analog tab
6.On the Source column, select the Tag to monitor the alarm.
7.Insert as many alarms as needed and configure them according to the previous steps.
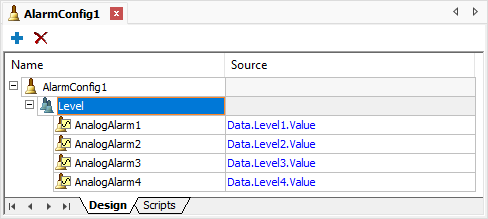
Alarms
•On the main Screen, users must be able to identify the logged-in user
1.Create a Display on the Screen.
2.Create a Simple Connection between the Display's Value property and the Viewer's User property.
3.Insert a Command Button near the Display.

Login button
4.In this Button, create the next script.
Application.Login(True)
5.Go to the File - Users menu and create at least one user.
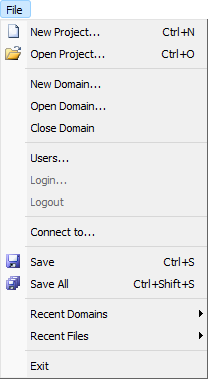
File - Users menu
•A user belonging to the Maintenance group MUST NOT acknowledge alarms
1.Go to the File - Users menu.
2.Create a Maintenance group.
3.Insert a user in the Maintenance group.
4.On the Permissions tab, block alarm acknowledgment for the Maintenance group.
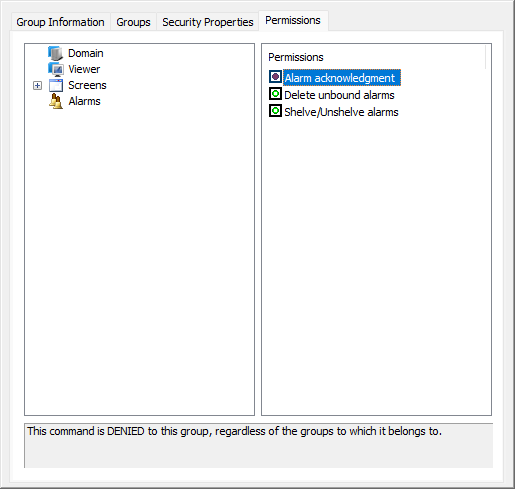
Permissions tab
•On a second Screen, users must be able to view those four levels on a chart, where they can select, using buttons, which information to display simultaneously
1.Create a new Screen.
2.Insert an E3Chart on this Screen.
3.Open the E3Chart's Properties Window and select the Pens tab.
4.Insert a Pen.
5.Select a name and a color.
6.On the Data tab, keep that Pen as Realtime and select a Tag in the Vertical axis link field.
7.Repeat the previous steps to include all other Pens.
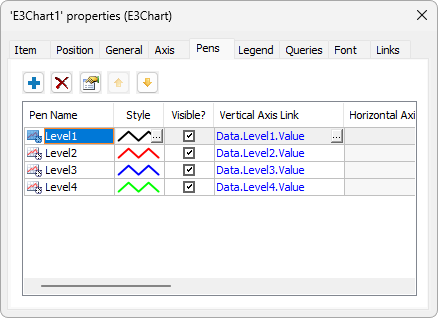
Pens tab
8.On the main Screen, create a Command Button to open the chart Screen.
•Store level data at every two seconds on a database
1.If the Domain does not have one yet, insert a Database object and configure it.
2.Insert a Historic object in the project.
3.Create Fields for each information and link them to their respective Tag on the Source column.
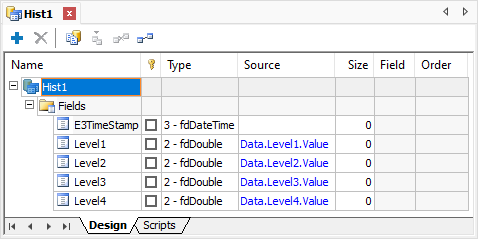
Source column
4.Open the Historic's Properties Window and configure the Database name, table name (LevelTable) and recording time (2000 ms).
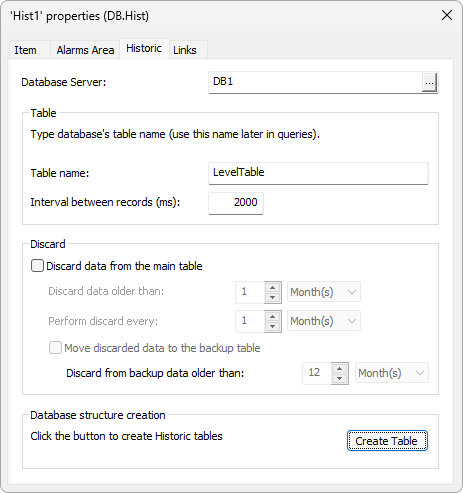
Historic tab
•View data stored on a database as a table, on the same chart Screen
1.Insert an E3Browser object on the Screen.
2.Open its Properties Window, select the Query tab, and click Configure.
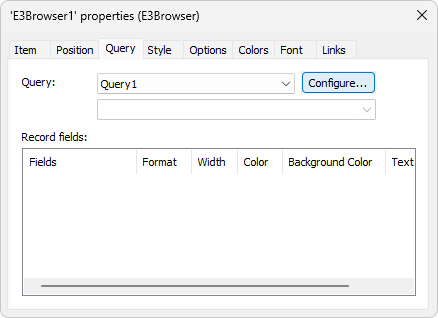
Configuring the Query
3.Configure the Query to retrieve the table on the Database.
4.Select the fields to retrieve and, on the Visualize tab, click Runs Query ![]() to preview data.
to preview data.
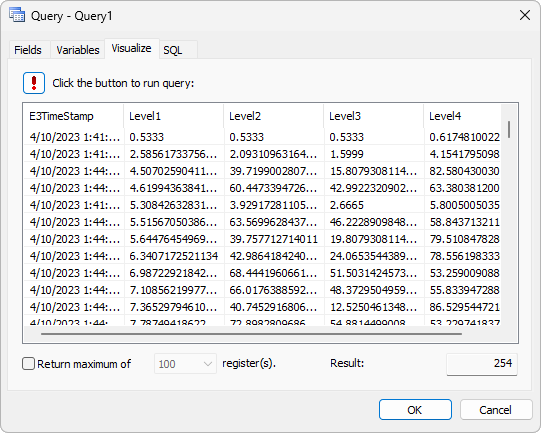
Visualize tab
•A report with the level data stored on the database must be exported to PDF format
1.Insert a Section Report in the project named as "LevelReport".
2.Configure the Section Report's Query to retrieve the table on the Database.
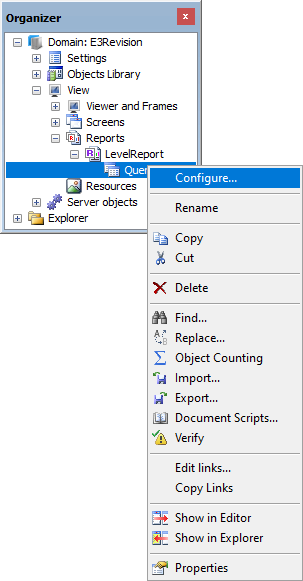
Option to configure a Query
3.Select the Level and E3TimeStamp fields.
4.Insert on the Detail Section a Field ![]() object for each selected column in the Query. Fill in the DataField property with the column's name.
object for each selected column in the Query. Fill in the DataField property with the column's name.
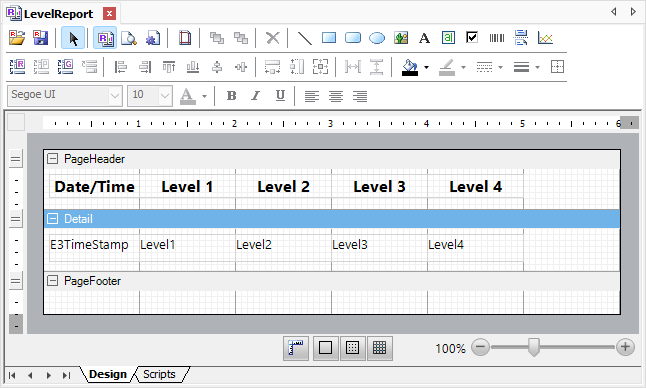
Detail Section
5.Use a Text object to type the column's title in the Caption property.
6.Insert on the Screen a Command Button with the next script.
Set Report = Application.LoadReport("LevelReport")
Report.Export "PDF", "LevelReport.pdf"